Activity 3: Weird and wonderful
365 = Days in a year
A cactus needs 1095 ml of water a year what i did to solve this out is 3 x 365 = 1095
Tuesday, December 18, 2018
Summer Learning Journey Day 2 Activity 2
Activity 2: Fabulous Ferns
Silver Ferns:
 Black Ferns:

Football Ferns:
 The uniform I like best is the black ferns because the shirt and shorts match because they are all one brand.
Silver Ferns:


Football Ferns:

Summer Learning Journey Day 2 Activity 1
Activity 1: Forest life
I would love to go and see the kauri tree because it is the longest and largest tree and who doesn't want to see the largest tree.

I would love to go and see the kauri tree because it is the longest and largest tree and who doesn't want to see the largest tree.

Summer Learning Journey Day 1 Activity 3
Activity 3: ice, ice baby
This is a foot print i made on what to share and what not to share online
This is a foot print i made on what to share and what not to share online

Summer Learning Journey Day 1 Activity 2
Activity 2: North and South
My Home town: Auckland
I love my hometown it has beautiful nature and fun places. I enjoy my hometown very much it has nice weather and it is very busy. On hot days its nice to go to the cool beaches and relax. it is great to call Auckland my hometown

My Home town: Auckland
I love my hometown it has beautiful nature and fun places. I enjoy my hometown very much it has nice weather and it is very busy. On hot days its nice to go to the cool beaches and relax. it is great to call Auckland my hometown

Summer Learning Journey day 1 Activity 1
Activity 1
The Legend of NZ
3 Fun facts about NZ:
1. The maori word for New Zealand is Aotearoa.
2. The largest city in New Zealand is Auckland but the capital is Wellington.
3. When your driving in New Zealand you have to drive on the left side of the road.
The Legend of NZ
3 Fun facts about NZ:
1. The maori word for New Zealand is Aotearoa.
2. The largest city in New Zealand is Auckland but the capital is Wellington.
3. When your driving in New Zealand you have to drive on the left side of the road.
Wednesday, December 5, 2018
Summer learning Task #2
Letter to Mr Hadnett:
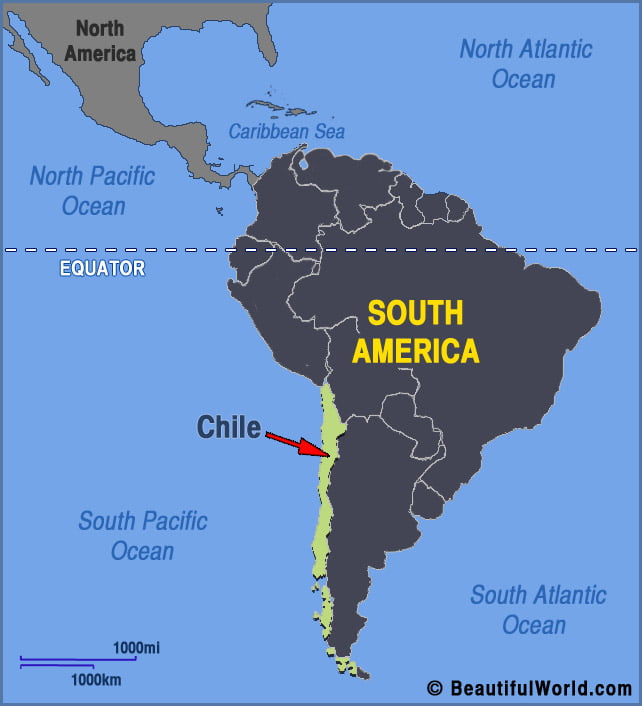
Dear Mr Hadnett I will like to go to Chile so I can see the Easter island . 2 facts about this country is that the worlds biggest pool is in Chile, 16,000 fireworks were exploded in the chilean city valparaiso in 2007. the way i'm going to travel is by a plane
Dear Mr Hadnett I will like to go to Chile so I can see the Easter island . 2 facts about this country is that the worlds biggest pool is in Chile, 16,000 fireworks were exploded in the chilean city valparaiso in 2007. the way i'm going to travel is by a plane
Summer learning Task #1
Country: chile
Reasons: want to learn about something new and didn't want to do the same as everyone else. .
.
Reasons: want to learn about something new and didn't want to do the same as everyone else.
.
Friday, November 16, 2018
Pray of the faithful
Heavenly father and greatest of all teachers,
Look upon our teachers with love and may you bless them. may you bless all the students who care for on another Amen
Wednesday, September 19, 2018
Weather Temperatures in Auckland and Wellington


My Interpretation
For Wellington the averages were:
The high average was: 10.6
The low average was : 7.4
In Wellington Monday was the hottest day. It was 13 degrees celsius.
Wednesday was the coldest day and it was 8 degrees celsius.
Mode:
High:10
Low: 8
Range for high:13-10= 3
Range for low: 6-8=3
For Auckland the averages were
The average high was: 14.6
The average low was: 7.4
Mode
High:14
Low:7
Range for High : 17-14 = 3
Range for Low; 9-6 = 4
In Auckland Monday was the hottest and it was 14 degrees celsius. Tuesday, Wednesday and Friday were the
coldest days. They were 7 degrees celsius.
coldest days. They were 7 degrees celsius.
If a was to pick a city to live in I would pick Auckland because it has warmer days.
Tuesday, September 11, 2018
The Mintie Challenge

My Interpretation
Sayonara’s Mintie wrapper was the longest because she was taking her time and wasn't talking to the students around her. Sayanara’s Mintie wrapper was 102 cm.
Nigel’s Mintie wrapper was the shortest because he was rushing. Nigels wrapper was 36.3cm.
The average measurement was 63.41cm (63cm)
I was slightly above the average I got 67cm.
There were 15 students above the average measurement.
There were 7 students below the average measurement.
The range was: 102 - 36.3= 65.7cm.
The mode was within the 40’s and 50’s. These measurements kept showing up more than once.
Wednesday, August 29, 2018
How do you get to school?
Last week we went around asking students in my maths class how they get to school. this is the graph I made on google sheets. We have tallied up all the totals and put it into a pie chart and bar chart

 My Interpretation
Bus and bike were the least popular because bus fares are expensive and people might not want to get injured
cycling to school. The roads are dangerous and busy. If A was to cycle to school, there would be no where to put
my bike because there are no bike stands. When it is a wet day there is more traffic and it is not safe to cycle on
the roads. Only five people walk to school because they live close to the school
My Interpretation
I think travelling to school by car was the most popular because a lot of people own cars and it's a faster way to
get to school in. 16 people in my maths class come to school in car compared to zero students who do not travel to
school by bus and bike
get to school in. 16 people in my maths class come to school in car compared to zero students who do not travel to
school by bus and bike
Bus and bike were the least popular because bus fares are expensive and people might not want to get injured
cycling to school. The roads are dangerous and busy. If A was to cycle to school, there would be no where to put
my bike because there are no bike stands. When it is a wet day there is more traffic and it is not safe to cycle on
the roads. Only five people walk to school because they live close to the school
Friday, August 24, 2018
Lions reports
Lions are the king of the jungels. Lions are very fast animals they run up
to 81 km per hour.
to 81 km per hour.
Did you know that a female lions needs at least 5 kg of meat
and a male lion needs 7 kg of meat if you were to find a lion they are mostly
found in the wild and in the eastern africa you can also find lions in the nation
park gir forest
and a male lion needs 7 kg of meat if you were to find a lion they are mostly
found in the wild and in the eastern africa you can also find lions in the nation
park gir forest
Lions have a goldish yellowish fur that can camouflage when they are in grass
and trying to find predators.Lions have manes but the female lions don't have
mains but the female lions are much smaller than the male lion.male lions
have much darker skin than the female.
and trying to find predators.Lions have manes but the female lions don't have
mains but the female lions are much smaller than the male lion.male lions
have much darker skin than the female.
Lions have a lot of preys theses are some of them Zebras,Buffalos,Baby
Elephants,Hippos,Rhinos and Crocodiles.But they also have small preys like
mice,lizards,Birds and tortoises.
Elephants,Hippos,Rhinos and Crocodiles.But they also have small preys like
mice,lizards,Birds and tortoises.
Lions are very fast animals they run up to 81 km per hour and they live upto
12 to 16 years but in captivity they lie up to 25 years time.
12 to 16 years but in captivity they lie up to 25 years time.
Lions are in danger but I think they shouldn't be because they should be able to
live there live like other people and animals till the end of time.
live there live like other people and animals till the end of time.
Thursday, August 23, 2018
How do you get to school


Car was the most because people maybe don't live in the zone and have to come in car
i think the least was bus and bike because people may not have enough money for 5 days a week to come to school in bus and for bike the kids might be lazy or tired or the weather could be bad.
Subscribe to:
Posts (Atom)